InferenceMax AI benchmark tests software stacks, efficiency, and TCO — vendor-neutral suite runs nightly and tracks performance changes over time
News coverage surrounding artificial intelligence almost invariably focuses on the deals that send hundreds of billions of dollars flying, or the latest hardware developments in the GPU or datacenter world. Benchmarking efforts have almost exclusively focused on the silicon, though, and that’s what SemiAnalysis intends to address with its open-source InferenceMax AI benchmarking suite. It…
News coverage surrounding artificial intelligence almost invariably focuses on the deals that send hundreds of billions of dollars flying, or the latest hardware developments in the GPU or datacenter world. Benchmarking efforts have almost exclusively focused on the silicon, though, and that’s what SemiAnalysis intends to address with its open-source InferenceMax AI benchmarking suite. It measures the efficiency of the many components of AI software stacks in real-world inference scenarios (when AI models are actually “running” rather than being trained), and publishes those at the InferenceMax live dashboard.
InferenceMax is released under the Apache 2.0 license and measures the performance of hundreds of AI accelerator hardware and software combinations, in a rolling-release fashion, getting new results nightly with recent versions of the software. As the project states, existing benchmarks are done at fixed points in time and don’t necessarily show what the current versions are capable of; nor do they highlight the evolution (or regression, even) of software advancements across an entire AI stack with drivers, kernels, frameworks, models, and other components.

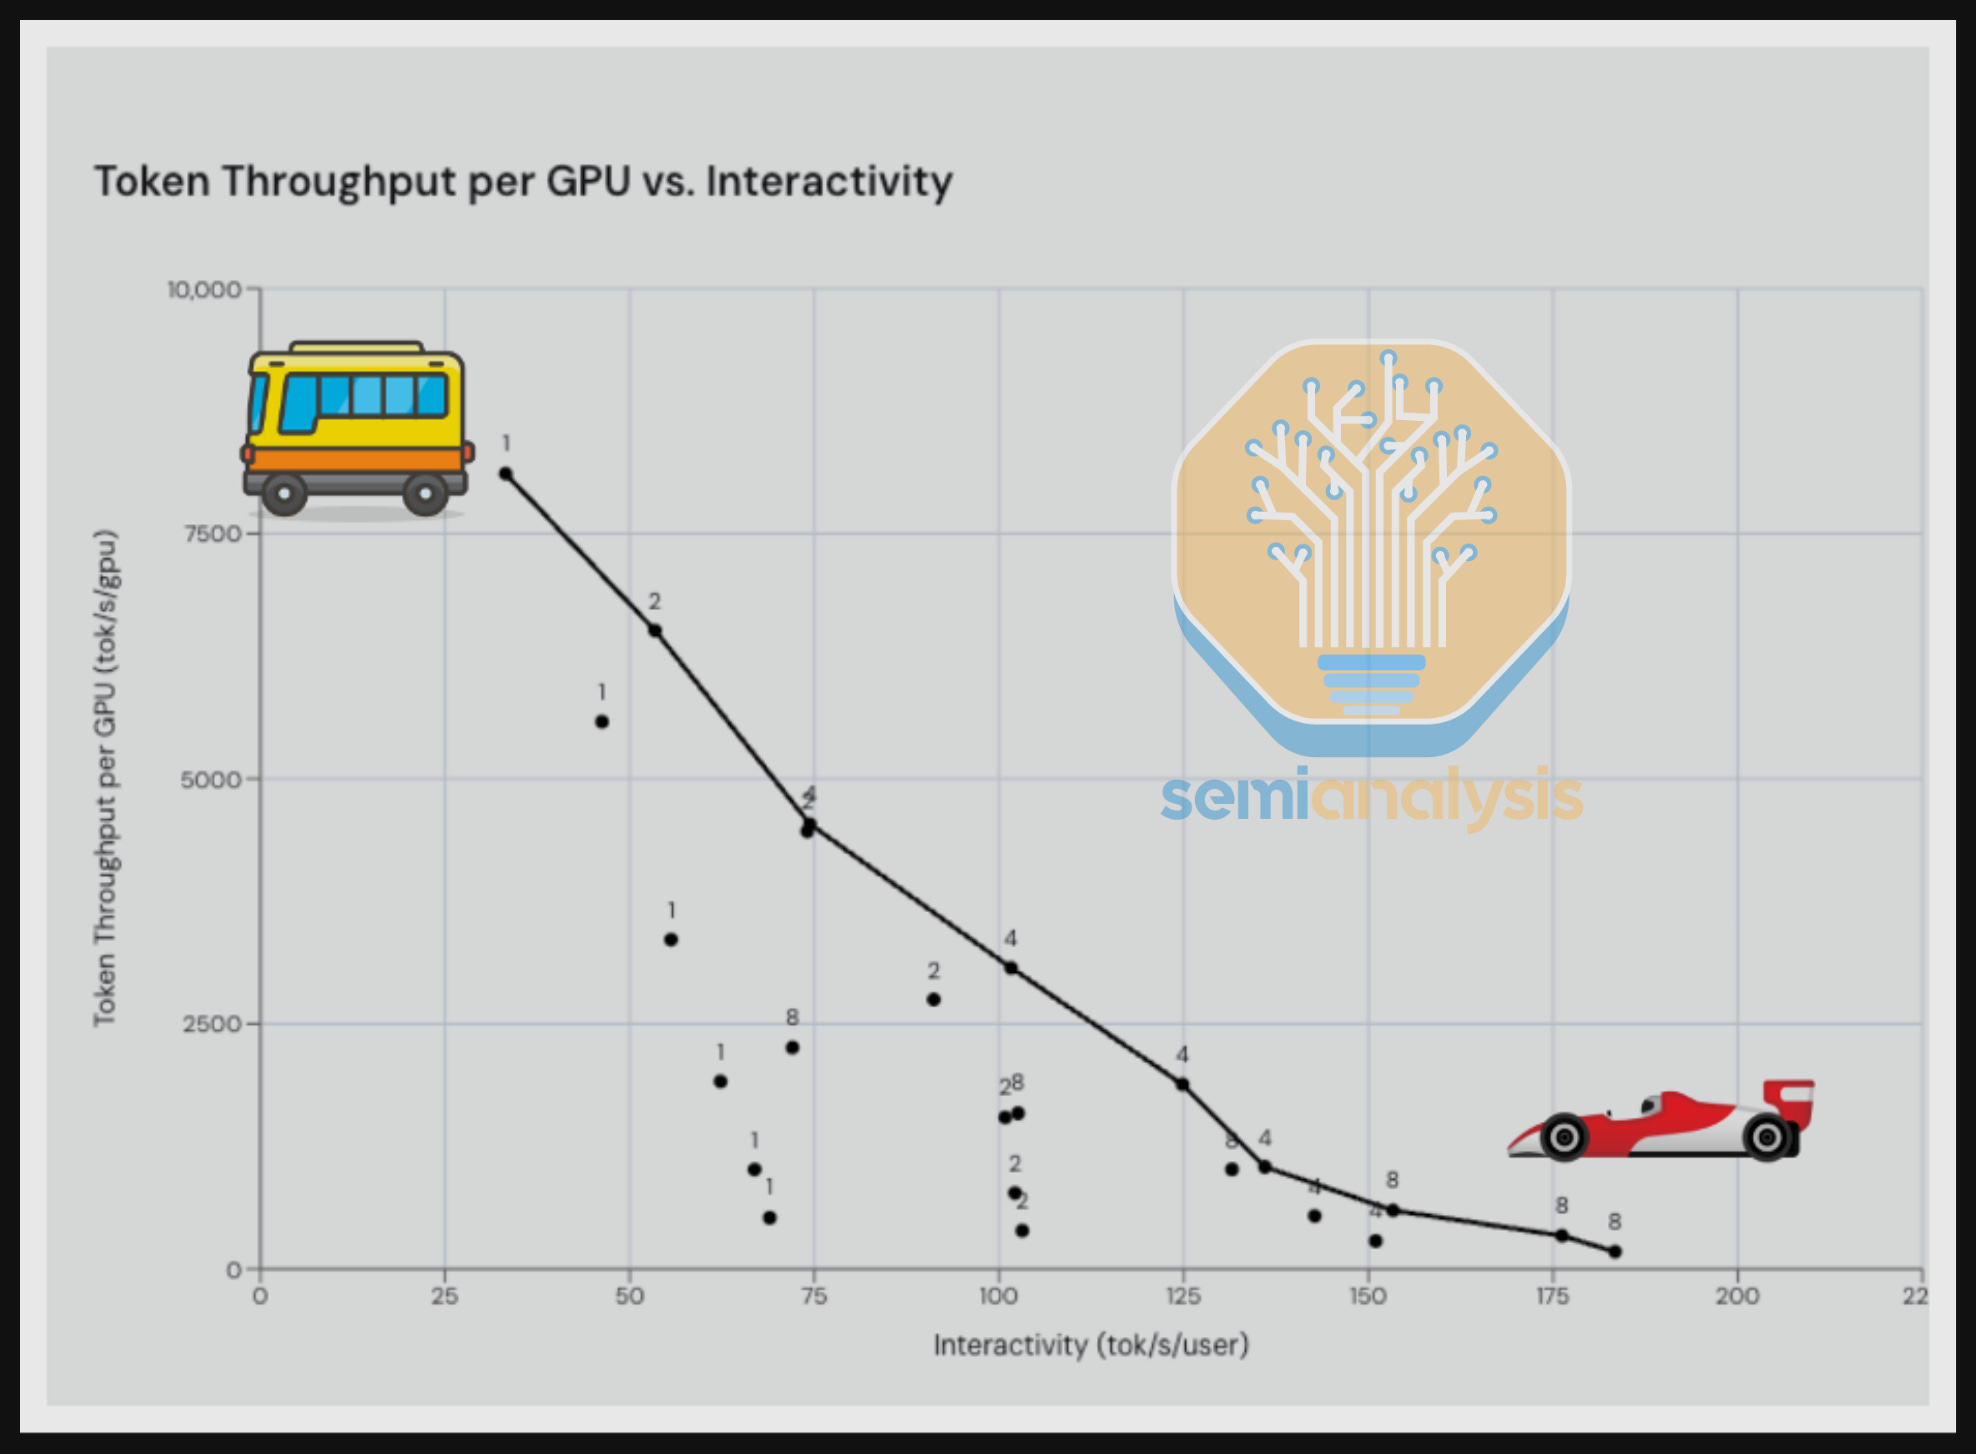
By the old adage of “fast, big, or cheap — pick two”, a high throughput (measured in tok/s/gpu), meaning optimal GPU usage, is best obtained by serving many clients at once, as LLM inference relies on matrix multiplication, which in turn benefits from batching many requests. However, serving many requests at once lowers how much time the GPU can dedicate to a single one, so getting faster output (say, in a chatbot conversation) means increasing interactivity (measured as tok/s/user) and lowering throughput. For example, if you’ve ever seen ChatGPT responding as if it had a bad stutter, you know what happens when throughput is set too high versus interactivity.
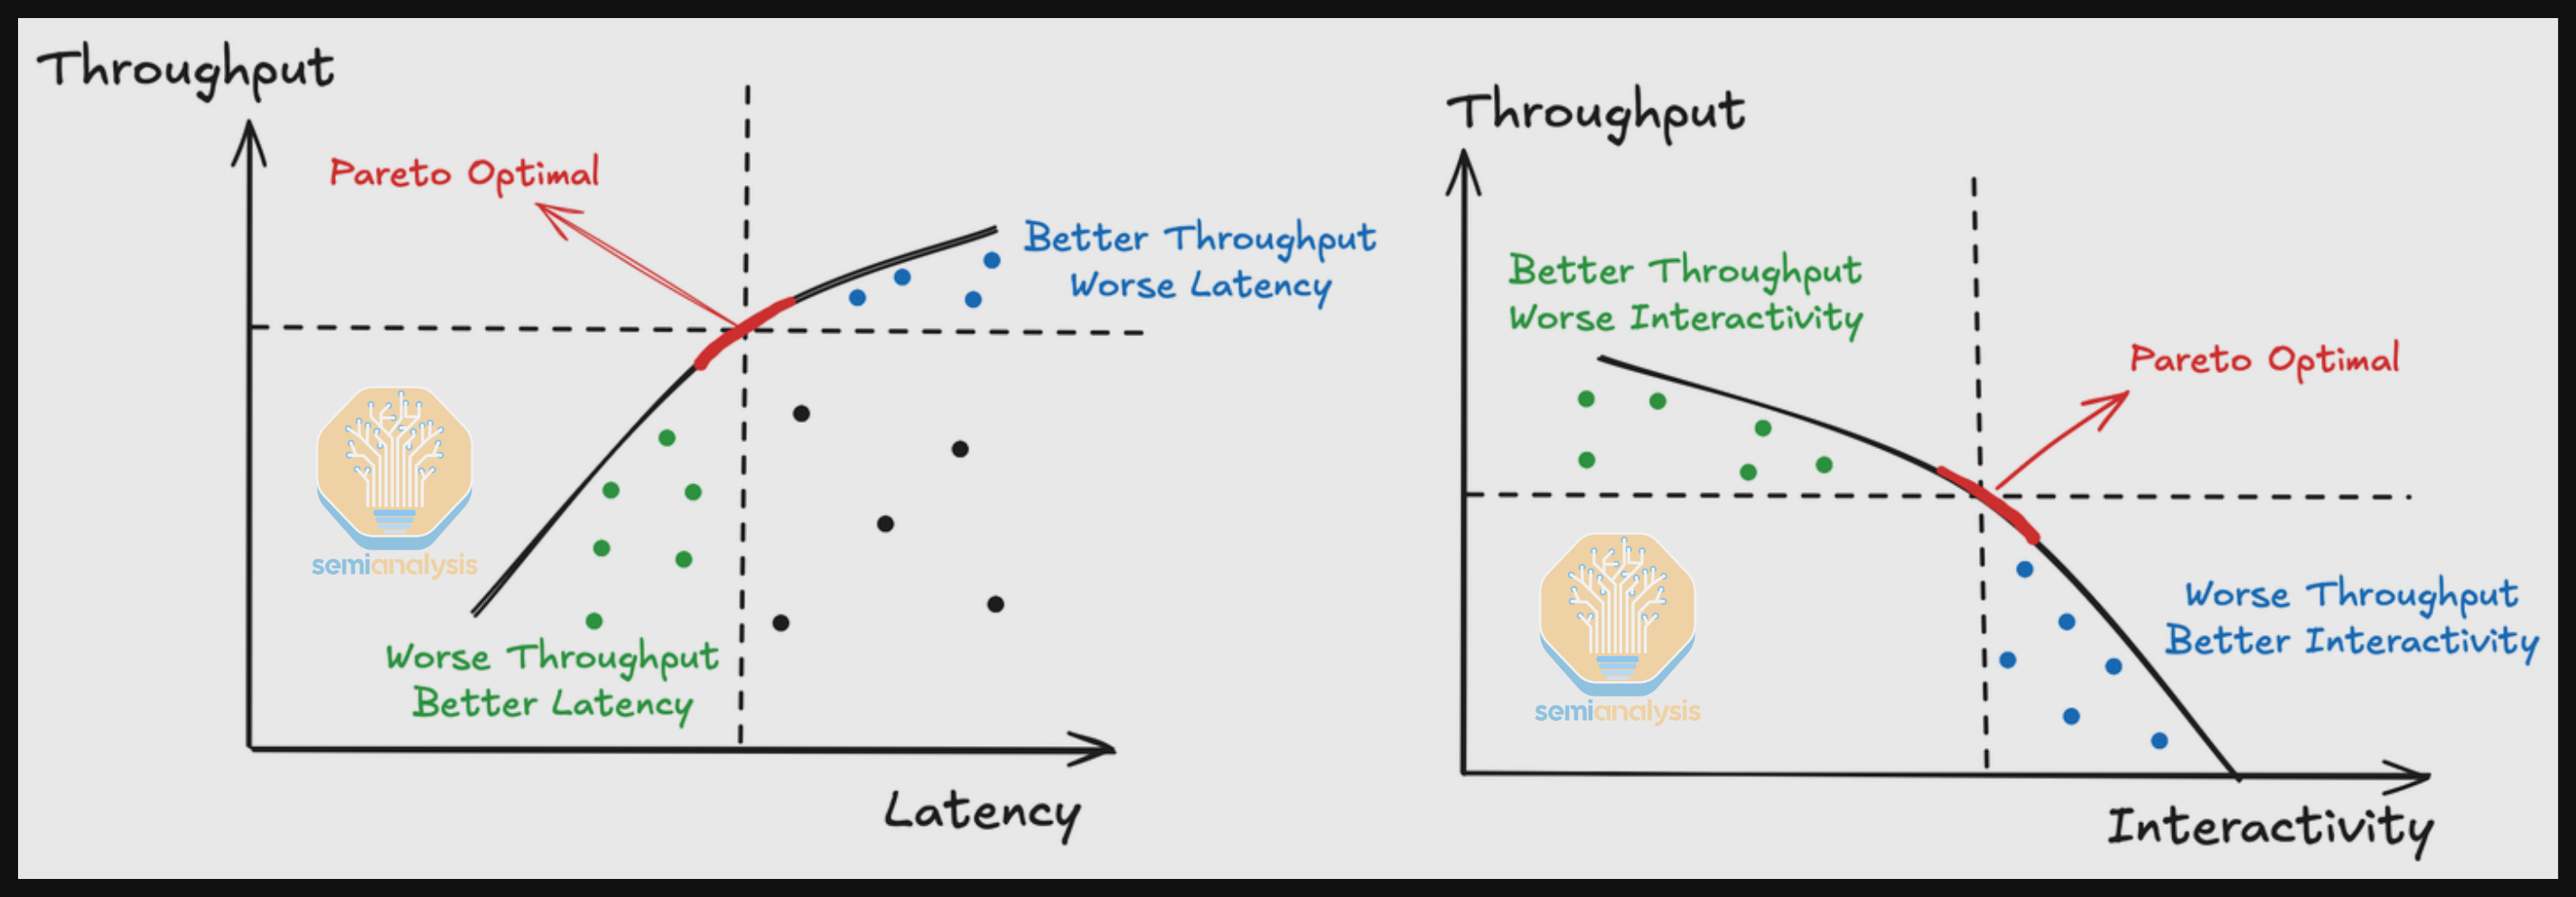
As in any Goldilocks-type scenario, there’s a perfect equilibrium between those two measures for a general-purpose setup. The ideal setup figures belong in the Pareto Frontier Curve, a specific area in a graph plotting throughput versus interactivity, handily illustrated by the diagram below. Since GPUs are purchased based on a dollar-per-hour cost when considering their price and power consumption (or when rented), the best GPU for any given scenario is not necessarily the fastest one — it’ll be the one that’s most efficient.

InferenceMax remarks that high-interactivity cases are pricier than high-throughput cases, although potentially more profitable, as they’ll be serving more users simultaneously. The one true measure for service providers, then, is the TCO, measured in dollars per million tokens. InferenceMax attempts to estimate this figure for various scenarios, including purchasing and owning GPUs versus renting them.
It’s important to note that simply looking at performance graphs for a given GPU plus its associated software stack won’t give you a good picture of what the best option is if all the metrics and the intended usage scenario aren’t taken into consideration. Besides, InferenceMax ought to display how changes to the software stack, rather than the chips, will affect all the metrics above, and thus the TCO.
As practical examples, InferenceMax remarks that AMD’s MI335X is actually competitive with Nvidia’s big B200 in TCO, even though the latter is way faster. On the other hand, AMD’s FP4 (a 4-bit floating-point format) kernels appear to have room for improvement, as scenarios/models that depend on this math are mostly the domain of Nvidia’s chips.
For its 1.0 release, InferenceMax supports a mix of Nvidia’s GB200, NVL72, B200, H200, and H100 accelerators, as well as AMD’s Instinct MI355X, MI325X, and MI300X. The project notes that it expects to add support for Google’s Tensor units and AWS Trainium in the coming months. The benchmarks are run nightly via GitHub’s action runners. Both AMD and Nvidia were asked for real-world configuration sets for GPUs and the software stack, as these can be tuned thousands of different ways.
While on the topic of vendor collaboration, InferenceMax thanks many people across major vendors and multiple cloud hosting providers who worked with the project, some even fixing bugs overnight. The project also uncovered multiple bugs in both Nvidia and AMD setups, highlighting the rapid pace of development and deployment of AI acceleration setups.
The collaboration resulted in patches to AMD’s ROCm (the equivalent of Nvidia’s CUDA), with InferenceMax noting that AMD should focus on providing its users with better default configurations, as there are reportedly too many parameters that need tuning to achieve optimal performance. On the Nvidia side, the project saw some headwinds with the freshly minted Blackwell drivers, encountering some snags around initialization/termination that became apparent in benchmarking scenarios that spin instances up and down in rapid succession.
If you have more than a passing interest in the area, you should read InferenceMax’s announcement and write-up. It’s a fun read and details the technical challenges encountered in a humorous fashion.

